RSNA Press Release
- Researchers used proton magnetic resonance spectroscopy to examine 106 patients who were obese based on BMI, but otherwise healthy.
- Obese people with higher levels of fat in their liver, muscle and blood also have higher amounts of fat in their bone marrow, putting them at risk for osteoporosis.
- Higher levels of bone marrow fat put people at increased risk of fracture.
Fat in Organs and Blood May Increase Risk of Osteoporosis
Released: July 16, 2013
| Media Contacts: | |
| RSNA Media Relations: | 1-630-590-7762 |
| Linda Brooks 1-630-590-7738 lbrooks@rsna.org |
Maureen Morley 1-630-590-7754 mmorley@rsna.org |
OAK BROOK, Ill. — Excess fat around the belly has recently been identified as a risk factor for bone loss. Now, a new study has determined that excess liver and muscle fat also may be detrimental to bone.
The study, published online in the journal Radiology, found that obese people with higher levels of fat in their liver, muscle tissue and blood also have higher amounts of fat in their bone marrow, putting them at risk for osteoporosis.
"Obesity was once thought to be protective against bone loss," said study lead author Miriam A. Bredella, M.D., a radiologist at Massachusetts General Hospital and associate professor of radiology at Harvard Medical School in Boston. "We have found that this is not true."

While other studies have examined the relationship between visceral fat and bone mineral density, this study looked at fat inside bone marrow, the spongy tissue inside the bones of the body that produces stem cells.
"In our study, we focused on bone marrow fat because that is where our stem cells can develop into osteoblasts—the cells responsible for bone formation—or fat cells," Dr. Bredella said. "We also wanted to look at the relationship between bone marrow fat and other fat components, such as those in the liver and muscle."
Dr. Bredella and colleagues used proton magnetic resonance spectroscopy (MRS), a technique that allows for precise measurement of fat, to examine 106 men and women, ages 19 to 45 years, who were obese based on body mass index measurements, but otherwise healthy.
"MRS has no radiation, is quick to perform and can quantify the amount of fat within bone marrow, muscle and liver," Dr. Bredella said.
The MRS results showed that people with more liver and muscle fat had higher levels of fat in their bone marrow, independent of body mass index, age and exercise status. HDL cholesterol, the "good" type of cholesterol that is associated with a lower risk of heart disease, was inversely associated with bone marrow fat content.
Higher levels of bone marrow fat put people at increased risk of fracture, according to Dr. Bredella.
"Bone marrow fat makes bones weak," she said. "If you have a spine that's filled with fat, it's not going to be as strong."
Triglycerides, the type of fat found in the blood, also had a positive correlation with bone marrow fat, possibly because they stimulate osteoclasts, a type of cell that breaks up bone tissue.
More research is needed to further illuminate the mechanism behind this differentiation of stem cells. Dr. Bredella noted that cell-signaling molecules called cytokines are known to promote the conversion of stem cells into fat.
"Obesity can shift stem cell lineage, resulting in more bone marrow fat," she said.
"Ectopic and Serum Lipid levels Are Positively Associated with Bone Marrow Fat in Obesity." Collaborating with Dr. Bredella were Corey M. Gill, B.S., Anu V. Gerweck, N.P., Melissa G. Landa, B.A., Vidhya Kumar, M.A., Scott M. Daley, B.A., Martin Torriani, M.D., Karen K. Miller, M.D.
Radiology is edited by Herbert Y. Kressel, M.D., Harvard Medical School, Boston, Mass., and owned and published by the Radiological Society of North America, Inc. (http://radiology.rsna.org/)
RSNA is an association of more than 51,000 radiologists, radiation oncologists, medical physicists and related scientists, promoting excellence in patient care and health care delivery through education, research and technologic innovation. The Society is based in Oak Brook, Ill. (RSNA.org)
For patient-friendly information on medical imaging, visit RadiologyInfo.org.
# # #
"Ectopic and Serum Lipid levels Are Positively Associated with Bone Marrow Fat in Obesity." Collaborating with Dr. Bredella were Corey M. Gill, B.S., Anu V. Gerweck, N.P., Melissa G. Landa, B.A., Vidhya Kumar, M.A., Scott M. Daley, B.A., Martin Torriani, M.D., Karen K. Miller, M.D.
Radiology is edited by Herbert Y. Kressel, M.D., Harvard Medical School, Boston, Mass., and owned and published by the Radiological Society of North America, Inc. (http://radiology.rsna.org/)
RSNA is an association of more than 51,000 radiologists, radiation oncologists, medical physicists and related scientists, promoting excellence in patient care and health care delivery through education, research and technologic innovation. The Society is based in Oak Brook, Ill. (RSNA.org)
For patient-friendly information on medical imaging, visit RadiologyInfo.org.
Video
 Video 1 Dr. Miriam A. Bredella discusses how to prevent bone degeneration. |
Images
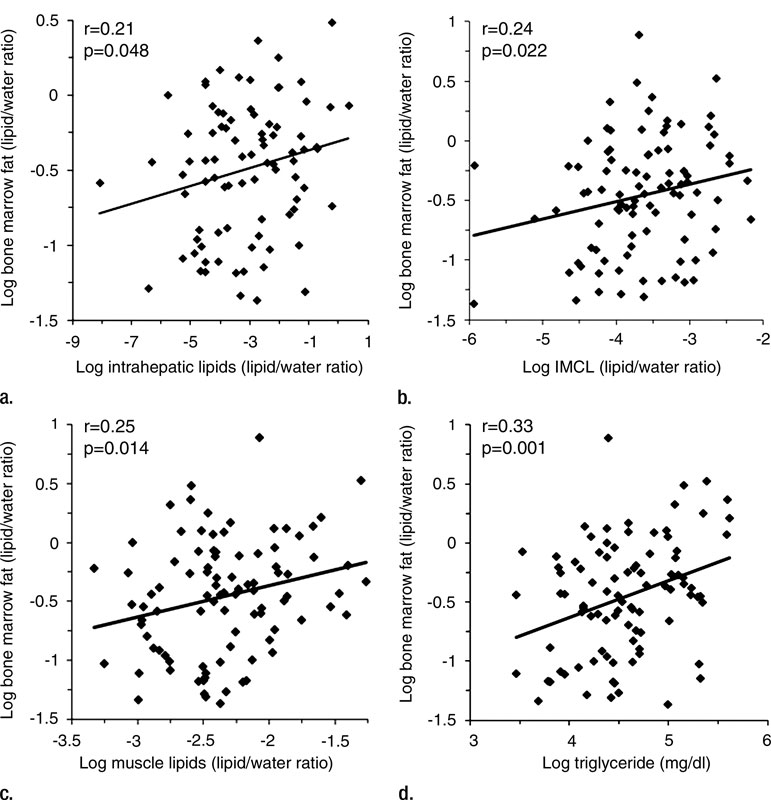 Figure 1 (a–d) Nonadjusted regression analysis between bone marrow fat and ectopic and serum lipid levels. There are positive correlations between bone marrow fat and (a) IHL, (b) IMCL, (c) total muscle lipid levels, and (d) serum triglyceride levels. High-res (TIF) version (Right-click and Save As) |
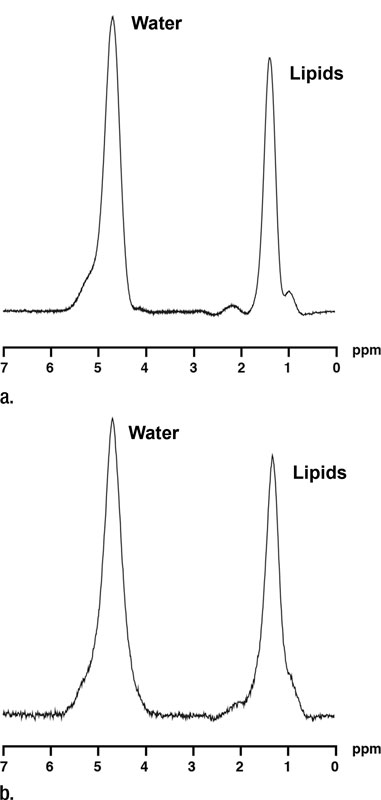 Figure 2 1H MR spectroscopy of liver and bone marrow in a 35-year-old obese man (BMI, 37.4 kg/ m2) with high IHL content. For purposes of visual comparison, the amplitude of unsuppressed water in Figures 2 and 3 were scaled identically. (a) 1H MR spectrum of liver shows lipid (1.3 ppm) and unsuppressed water (4.7 ppm) resonances. (b) 1H MR spectrum of bone marrow at L4 shows lipid (1.3 ppm) and unsuppressed water (4.7 ppm) resonances. High-res (TIF) version (Right-click and Save As) |
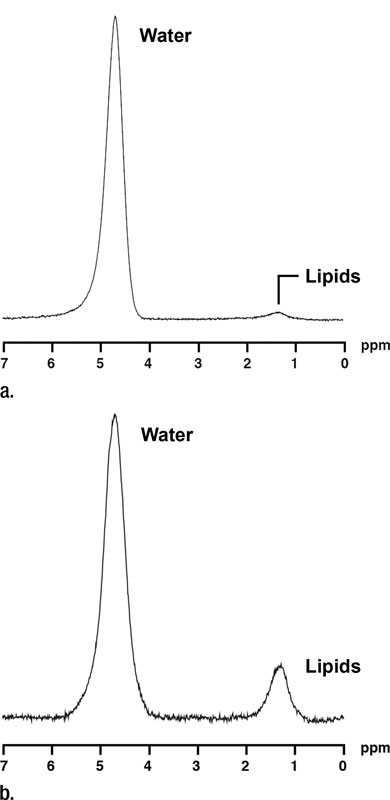 Figure 3 1H MR spectroscopy of liver and bone marrow in a 37-year-old obese man with similar BMI as subject in Figure 2 (BMI, 37.2 kg/m2) but with lower IHL content. Despite similar age and BMI, this obese man has lower bone marrow fat content (0.3 vs 0.93 lipid-water ratio). (a) 1H MR spectrum of liver shows lipid (1.3 ppm) and unsuppressed water (4.7 ppm) resonances. (b) 1H MR spectrum of bone marrow at L4 shows lipid (1.3 ppm) and unsuppressed water (4.7 ppm) resonances. High-res (TIF) version (Right-click and Save As) |
 PDF
PDF