RSNA Press Release
- Exercise can reduce fat stored in or around vital organs of people with type 2 diabetes.
- Researchers assessed the effects of exercise alone, without other lifestyle or diet changes.
- The World Health Organization projects type 2 diabetes will be the seventh leading cause of death worldwide by 2030.
Exercise Benefits Patients with Type 2 Diabetes
Released: June 25, 2013
| Media Contacts: | |
| RSNA Media Relations: | 1-630-590-7762 |
| Linda Brooks 1-630-590-7738 lbrooks@rsna.org |
Maureen Morley 1-630-590-7754 mmorley@rsna.org |
OAK BROOK, Ill. — Moderate-intensity exercise reduces fat stored around the heart, in the liver and in the abdomen of people with type 2 diabetes mellitus, even in the absence of any changes in diet, according to a new study published online in the journal Radiology.
Type 2 diabetes occurs when the body does not produce enough insulin, a hormone that regulates the movement of sugar into the cells, or when the cells resist the effects of insulin. The disease can lead to a wide range of complications, including damage to the eyes and kidneys and hardening of the arteries.
Exercise is recommended for people with diabetes, but its effects on different fat deposits in the body are unclear, according to the study's senior author, Hildo J. Lamb, M.D., Ph.D., from the Department of Radiology at Leiden University Medical Center in the Netherlands.

"Based on previous studies, we noticed that different fat deposits in the body show a differential response to dietary or medical intervention," he said. "Metabolic and other effects of exercise are hard to investigate, because usually an exercise program is accompanied by changes in lifestyle and diet."
For the new study, Dr. Lamb and colleagues assessed the effects of exercise on organ-specific fat accumulation and cardiac function in type 2 diabetes patients, independent of any other lifestyle or dietary changes. The 12 patients, average age 46 years, underwent MRI examinations before and after six months of moderate-intensity exercise totaling between 3.5 and six hours per week and featuring two endurance and two resistance training sessions. The exercise cycle culminated with a 12-day trekking expedition.
MRI results showed that, although cardiac function was not affected, the exercise program led to a significant decrease in fat volume in the abdomen, liver and around the heart, all of which have been previously shown to be associated with increased cardiovascular risk.
"In the present study we observed that the second layer of fat around the heart, the peracardial fat, behaved similarly in response to exercise training as intra-abdominal, or visceral fat," Dr. Lamb said. "The fat content in the liver also decreased substantially after exercise."
Dr. Lamb noted that the exercise-induced fat reductions in the liver are of particular importance to people with type 2 diabetes, many of whom are overweight or obese.
"The liver plays a central role in regulating total body fat distribution," he said. "Therefore, reduction of liver fat content and visceral fat volume by physical exercise are very important to reverse the adverse effects of lipid accumulation elsewhere, such as the heart and arterial vessel wall."
The findings point to an important role for imaging in identifying appropriate treatment for patients with type 2 diabetes, which the World Health Organization projects to be the seventh leading cause of death worldwide by 2030.
"In the future, we hope to be able to use advanced imaging techniques to predict in individual patients which therapeutic strategy is most effective: diet, medication, exercise, surgery or certain combinations," Dr. Lamb said.
# # #
"Exercise and Type 2 Diabetes Mellitus: Changes in Tissue-Specific Fat Distribution and Cardiac Function." Collaborating with Dr. Lamb were Jacqueline T. Jonker, M.D., Pieter de Mol, M.D., Suzanna T. de Vries, M.D., Ralph L.Widya, M.D., Sebastiaan Hammer, M.D., Ph.D., Linda D. van Schinkel, M.D., Rutger W. van der Meer, M.D., Ph.D., Rijk O.B. Gans, M.D., Ph.D., Andrew G. Webb, Ph.D., Hermien E. Kan, Ph.D., Eelco J.P. de Koning, M.D., Ph.D., and Henk J.G. Bilo, M.D., Ph.D.
Radiology is edited by Herbert Y. Kressel, M.D., Harvard Medical School, Boston, Mass., and owned and published by the Radiological Society of North America, Inc. (http://radiology.rsna.org/)
RSNA is an association of more than 51,000 radiologists, radiation oncologists, medical physicists and related scientists, promoting excellence in patient care and health care delivery through education, research and technologic innovation. The Society is based in Oak Brook, Ill. (RSNA.org)
For patient-friendly information on MRI, visit RadiologyInfo.org.
Images
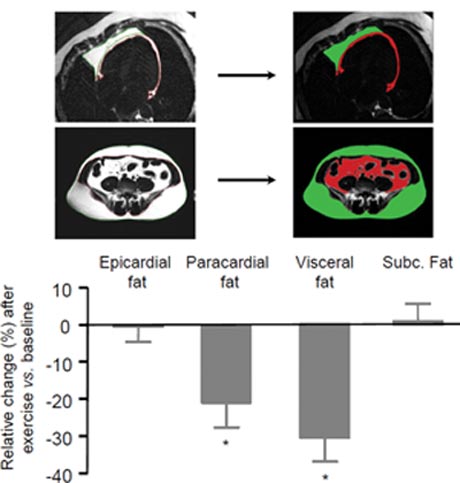 Figure 1. Top: Quantification of (upper figures) epicardial (red) and paracardi¬al fat (green) volume and (lower figures) visceral (red) and subcutaneous (green) abdominal fat. For the abdominal fat, only one transverse section is shown; three sections were imaged. The area of fat of each individual section was mul¬tiplied by the section thickness to estimate the volume, and the volumes of all three sections were summed. Bottom: Box and whisker plot of relative changes in epicardial and paracardial (11 patients) and visceral and subcutaneous (Subc.) abdominal fat volume (12 patients) after 6 months of exercise compared with before start of training (12 patients; seven men, five women; mean age, 46 years ± 2). * = P < .05 change after exercise compared with baseline. High-res (TIF) version (Right-click and Save As) |
 Figure 2. Top: Graph of placement of voxel for quantification of hepatic TG content and two representative proton MR spectra before and after exercise in one patient. A water-suppressed spectrum for TG signal resonances and a spectrum without water suppression as internal standard were obtained. Box in the image represents the voxel placed in the liver to assess the MR spectra. Imaging parameters were 3000/26. Bottom: Box and whisker plot shows relative changes in body weight, hepatic TG content, and alanine aminotrans¬ferase (ALAT) after 6 months of exercise compared with baseline (12 patients; seven men, five women; mean age, 46 years ± 2). * = P < .05 change after exercise compared with baseline. High-res (TIF) version (Right-click and Save As) |
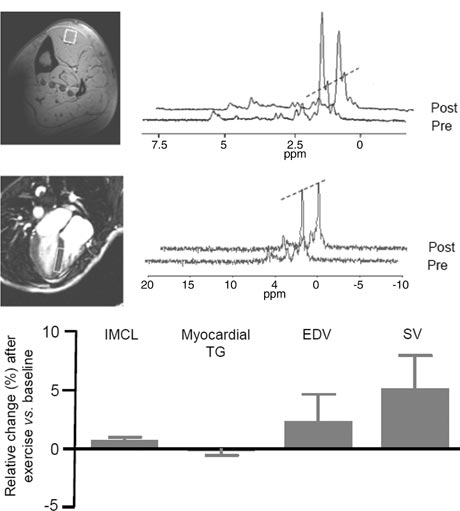 Figure 3. Top: Image of voxel placement for quantification of IMCLs in left anterior tibialis muscle and myocardial TG content in the cardiac septum. The box in the top image repre¬sents the placement of the voxel for myocardial assessment of MR spectra. Graph represents two representative proton MR spectra for IMCLs and myocardial TG content before and after exercise in one patient. Dotted line compares both spectral peaks; they are similar before and after training. For the myocardial TG content, a water-suppressed spectrum for TG signal res¬onances and a spectrum without water suppression for the internal standard were obtained. Myocardial TG content imaging parameters were 3000/26. IMCL imaging parameters were 2000/22. Bottom: Box and whisker plot of relative changes in IMCLs, myocardial TG content, end-diastolic volume (EDV), and stroke volume (SV) after 6 months of exercise compared with baseline (12 patients; seven men, five women; mean age, 46 years ± 2). No statistically significant changes were observed. High-res (TIF) version (Right-click and Save As) |
 PDF
PDF