RSNA Press Release
- Prenatal or early childhood exposure to lead results in permanent brain damage in adults.
- Childhood lead exposure has been associated with diminished IQ, inability to focus, poor academic performance and increased risk of criminal behavior.
- Sources of residual lead include water, soil and lead-based paint.
Childhood Lead Exposure Causes Permanent Brain Damage
Released: December 1, 2009
| Media Contacts: | RSNA Newsroom | 1-312-949-3233 |
| Before 11/28/09 or after 12/03/09: | RSNA Media Relations: | 1-630- 590-7762 |
| |
Linda Brooks 1-630-590-7738 lbrooks@rsna.org |
Maureen Morley 1-630-590-7754 mmorley@rsna.org |
CHICAGO — A study using functional magnetic resonance imaging (fMRI) to evaluate brain function revealed that adults who were exposed to lead as children incur permanent brain injury. The results were presented today at the annual meeting of the Radiological Society of North America (RSNA).
"What we have found is that no region of the brain is spared from lead exposure," said the study's lead author, Kim Cecil, Ph.D., imaging scientist at Cincinnati Children's Hospital Medical Center and professor of radiology, pediatrics and neuroscience at the University of Cincinnati College of Medicine. "Distinct areas of the brain are affected differently."
The study is part of a large research project called the Cincinnati Lead Study, a long-term lead exposure study conducted through the Cincinnati Children's Environmental Health Center, a collaborative research group funded by the National Institute of Environmental Health Sciences and U.S. Environmental Protection Agency. The Cincinnati Lead Study followed prenatal and early childhood lead exposure of 376 infants from high-risk areas of Cincinnati between 1979 and 1987. Over the course of the project, the children underwent behavioral testing and 23 blood analyses that yielded a mean blood lead level.
Lead, a common and potent poison found in water, soil and lead-based paint, is especially toxic to children's rapidly developing nervous systems. Homes built before 1950 are most likely to contain lead-based paint, which can chip and be ingested by children.
"Lead exposure has been associated with diminished IQ, poor academic performance, inability to focus and increased risk of criminal behavior," Dr. Cecil said.
Dr. Cecil's study involved 33 adults who were enrolled as infants in the Cincinnati Lead Study. The mean age of the study participants, which included 14 women and 19 men, was 21 years. The participants' mean blood lead levels ranged from 5 to 37 micrograms per deciliter with a mean of 14. Participant histories showed IQ deficiencies, juvenile delinquency and a number of criminal arrests.
Each participant underwent fMRI while performing two tasks to measure the brain's executive functioning, which governs attention, decision making and impulse control. The imaging revealed that in order to complete a task that required inhibition, those with increased blood lead levels required activation from additional regions within the frontal and parietal lobes of the brain.
"This tells us that the area of the brain responsible for inhibition is damaged by lead exposure and that other regions of the brain must compensate in order for an individual to perform," Dr. Cecil said. "However, the compensation is not sufficient."
Imaging performed during a second task designed to test attention revealed an association between higher lead levels and decreased activation in the parietal region and other areas of the brain.
According to Dr. Cecil, the brain's white matter, which organizes and matures at an early age, adapts to lead exposure, while the frontal lobe, which is the last part of the brain to develop, incurs multiple insults from lead exposure as it matures.
"Many people think that once lead blood levels decrease, the effects should be reversible, but, in fact, lead exposure has harmful and lasting effects," she said.
Dr. Cecil believes that these findings lend support to previous reports from the Cincinnati Lead Study showing that the lasting neurological effect of lead exposure, rather than a poor social environment, is a key contributor to the subsequent cognitive and behavior problems in this group.
Co-authors are Kim M. Dietrich, Ph.D., M.S., Caleb M. Adler, M.D., James C. Eliassen, Ph.D., and Bruce P. Lanphear, M.D., M.P.H.
# # #
Note: Copies of RSNA 2009 news releases and electronic images will be available online at RSNA.org/press09 beginning Monday, Nov. 30.
RSNA is an association of more than 44,000 radiologists, radiation oncologists, medical physicists and related scientists committed to excellence in patient care through education and research. The Society is based in Oak Brook, Ill. (RSNA.org)
Editor's note: The data in these releases may differ from those in the printed abstract and those actually presented at the meeting, as researchers continue to update their data right up until the meeting. To ensure you are using the most up-to-date information, please call the RSNA Newsroom at 1-312-949-3233.
For patient-friendly information on fMRI, visit RadiologyInfo.org.
| Abstract: |
Images (.JPG format)
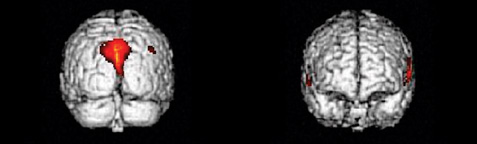 Figure 1. MRI images demonstrating the back (left) and front (right) regions of the brain with decreased activity when performing a task. High-res (TIF) version (Right-click and Save As) |
 Figure 2. MRI images demonstrating the back (left) and front (right) regions of the brain with increased activity when performing a task. High-res (TIF) version (Right-click and Save As) |
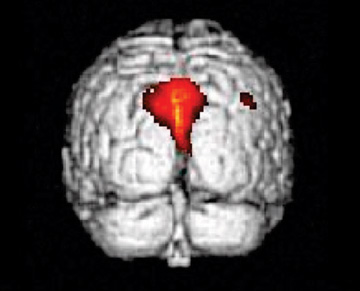 Figure 3. MRI image demonstrating the back region of the brain with decreased activity when performing a task. High-res (TIF) version (Right-click and Save As) |
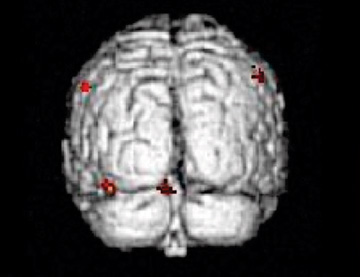 Figure 4. MRI image demonstrating the back region of the brain with increased activity when performing a task. High-res (TIF) version (Right-click and Save As) |
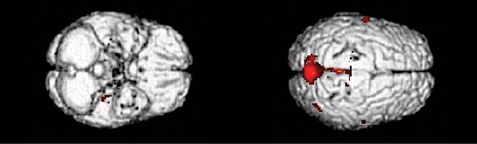 Figure 5. MRI images demonstrating the bottom (left) and top (right) regions of the brain with decreased activity when performing a task. High-res (TIF) version (Right-click and Save As) |
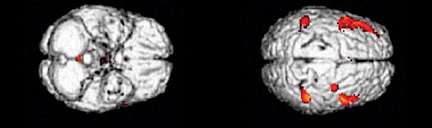 Figure 6. MRI images demonstrating the bottom (left) and top (right) regions of the brain with increased activity when performing a task. High-res (TIF) version (Right-click and Save As) |
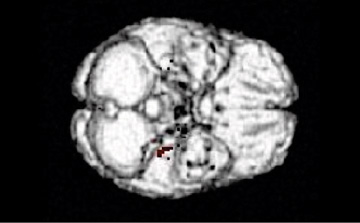 Figure 7. MRI image demonstrating the bottom region of the brain with decreased activity when performing a task. High-res (TIF) version (Right-click and Save As) |
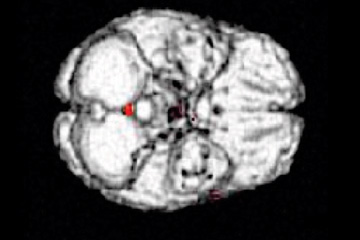 Figure 8. MRI image demonstrating the bottom region of the brain with increased activity when performing a task. High-res (TIF) version (Right-click and Save As) |
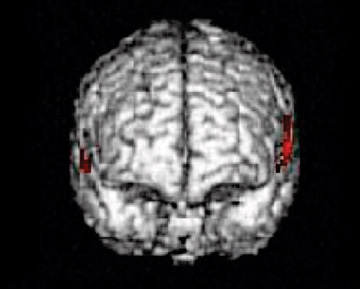 Figure 9. MRI image demonstrating the front region of the brain with decreased activity when performing a task. High-res (TIF) version (Right-click and Save As) |
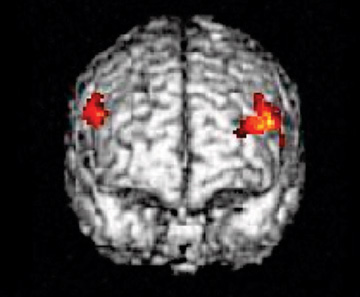 Figure 10. MRI image demonstrating the front region of the brain with increased activity when performing a task. High-res (TIF) version (Right-click and Save As) |
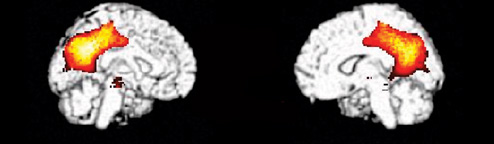 Figure 11. MRI images demonstrating the inner left (left) and right (right) hemispheres of the brain with decreased activity when performing a task. High-res (TIF) version (Right-click and Save As) |
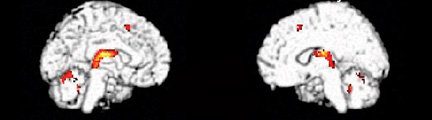 Figure 12. MRI images demonstrating the inner left (left) and right (right) hemispheres of the brain with increased activity when performing a task. High-res (TIF) version (Right-click and Save As) |
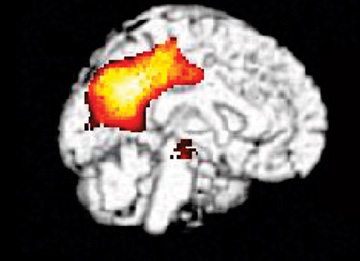 Figure 13. MRI image demonstrating the inner left hemisphere of the brain with decreased activity when performing a task. High-res (TIF) version (Right-click and Save As) |
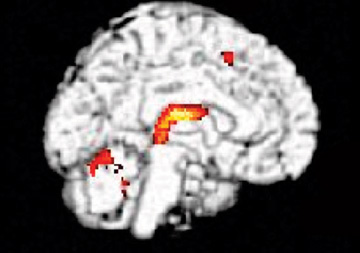 Figure 14. MRI image demonstrating the inner left hemisphere of the brain with increased activity when performing a task. High-res (TIF) version (Right-click and Save As) |
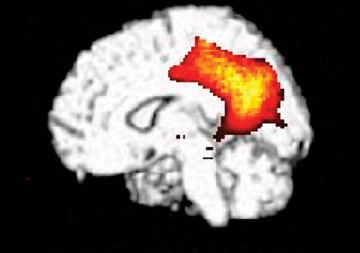 Figure 15. MRI image demonstrating the inner right hemisphere of the brain with decreased activity when performing a task. High-res (TIF) version (Right-click and Save As) |
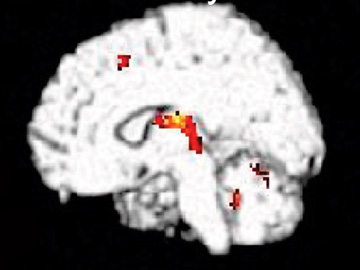 Figure 16. MRI image demonstrating the inner right hemisphere of the brain with increased activity when performing a task. High-res (TIF) version (Right-click and Save As) |
 Figure 17. MRI image demonstrating the left hemisphere of the brain with decreased activity when performing a task. High-res (TIF) version (Right-click and Save As) |
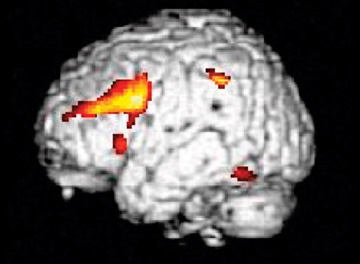 Figure 18. MRI image demonstrating the left hemisphere of the brain with increased activity when performing a task. High-res (TIF) version (Right-click and Save As) |
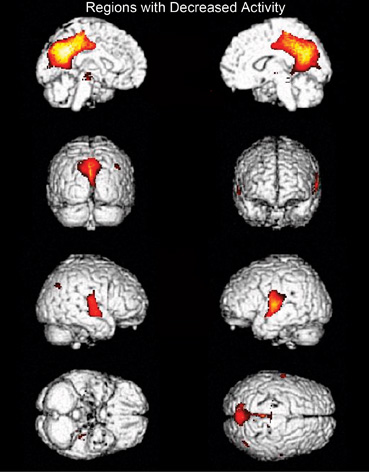 Figure 19. Multiple MRI images demonstrating different regions of the brain with decreased activity when performing a task. The top row shows the inner hemispheres. The second row shows the back (left) and front (right) regions of the brain. The third row shows the right (left) and left (right) hemispheres. The last row provides a view from the bottom (left) and top (right) regions of the brain. High-res (TIF) version (Right-click and Save As) |
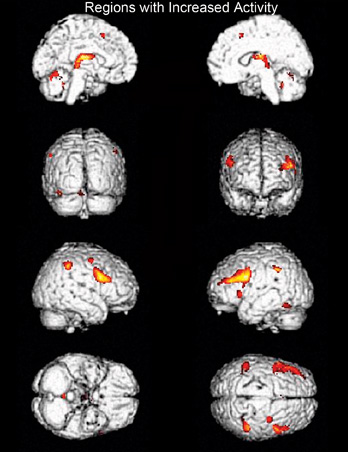 Figure 20. Multiple MRI images demonstrating different regions of the brain with increased activity when performing a task. The top row shows the inner hemispheres. The second row shows the back (left) and front (right) regions of the brain. The third row shows the right (left) and left (right) hemispheres. The last row provides a view from the bottom (left) and top (right) regions of the brain. High-res (TIF) version (Right-click and Save As) |
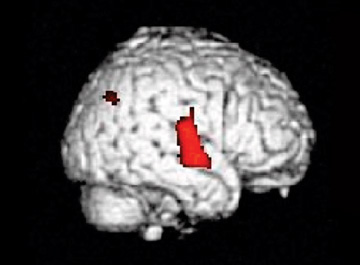 Figure 21. MRI image demonstrating the right hemisphere of the brain with decreased activity when performing a task. High-res (TIF) version (Right-click and Save As) |
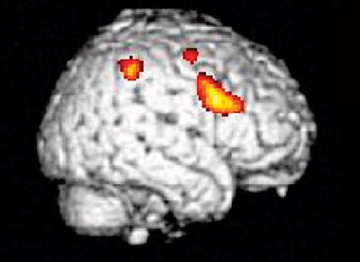 Figure 22. MRI image demonstrating the right hemisphere of the brain with increased activity when performing a task. High-res (TIF) version (Right-click and Save As) |
 Figure 23. MRI image demonstrating the right (left) and left (right) hemispheres of the brain with decreased activity when performing a task. High-res (TIF) version (Right-click and Save As) |
 Figure 24. MRI image demonstrating the right (left) and left (right) hemispheres of the brain with increased activity when performing a task. High-res (TIF) version (Right-click and Save As) |
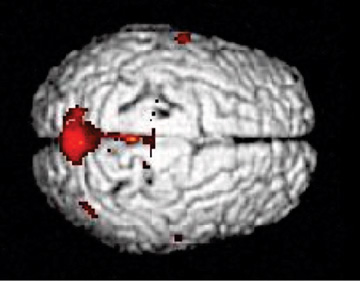 Figure 25. MRI image demonstrating the top region of the brain with decreased activity when performing a task. High-res (TIF) version (Right-click and Save As) |
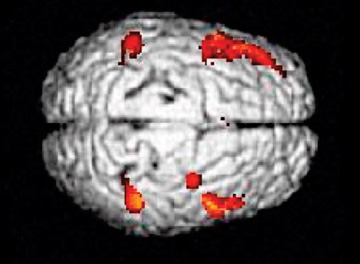 Figure 26. MRI image demonstrating the top region of the brain with increased activity when performing a task. High-res (TIF) version (Right-click and Save As) |
 PDF
PDF